In this two part lab assignment, the first job was to create a DSM in Pix 4D and find the volume values within an isolated area. In part two, the job was to make an elevation progression map between three sets of raster data of an isolated hill in Litchfield, WI.
Part 1:
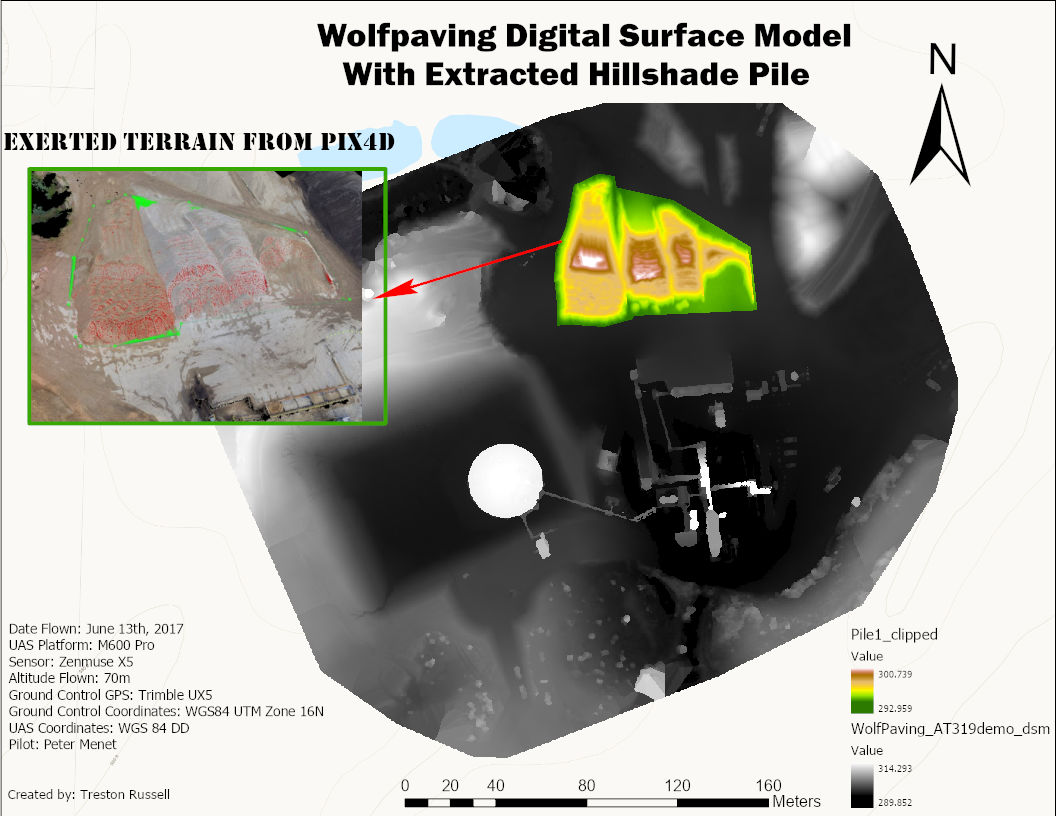
In part one of this project ArcGIS Pro was used to isolate a portion of the Wolf Creek data set, and determine the volumetrics (Figure 1-2). The Volume tool was used to outline the desired survey area. Within this area we can determine the terrain's 3D volume, cut volume, fill volume, and total volume (Figure 3). After the volume values are found, ArcGIS Pro was used to map the survey area along with calculating the area's elevations. The tools used to accomplish this part's goal were: Cookie Cutter to extract the desired area to calculate the raster data set, clip to create the polygon, Extract by Mask was used to extract the polygon to separate this from the original raster data set, and Surface Volume for to determine the area's volume and area (Figure 4-5). Then of course the area has to mapped to display the survey area, along with a comparison between the survey area and the original raster set.
 |
| Figure 1: Pix4D custom average output |
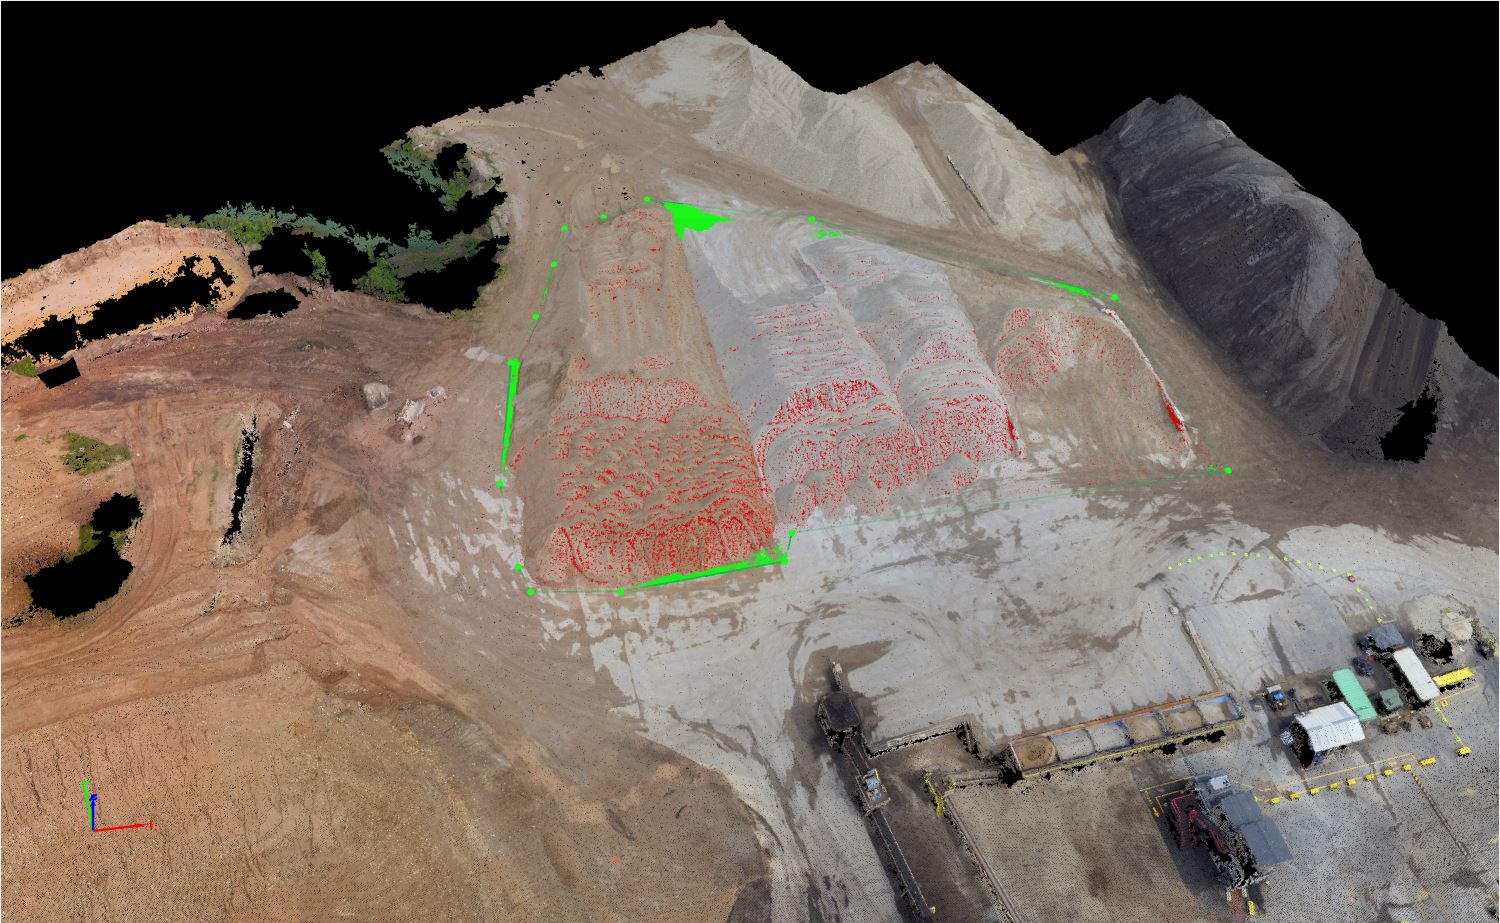 |
| Figure 2: Pix4D volume area |
 |
Figure 3: Pix4D default volume
|
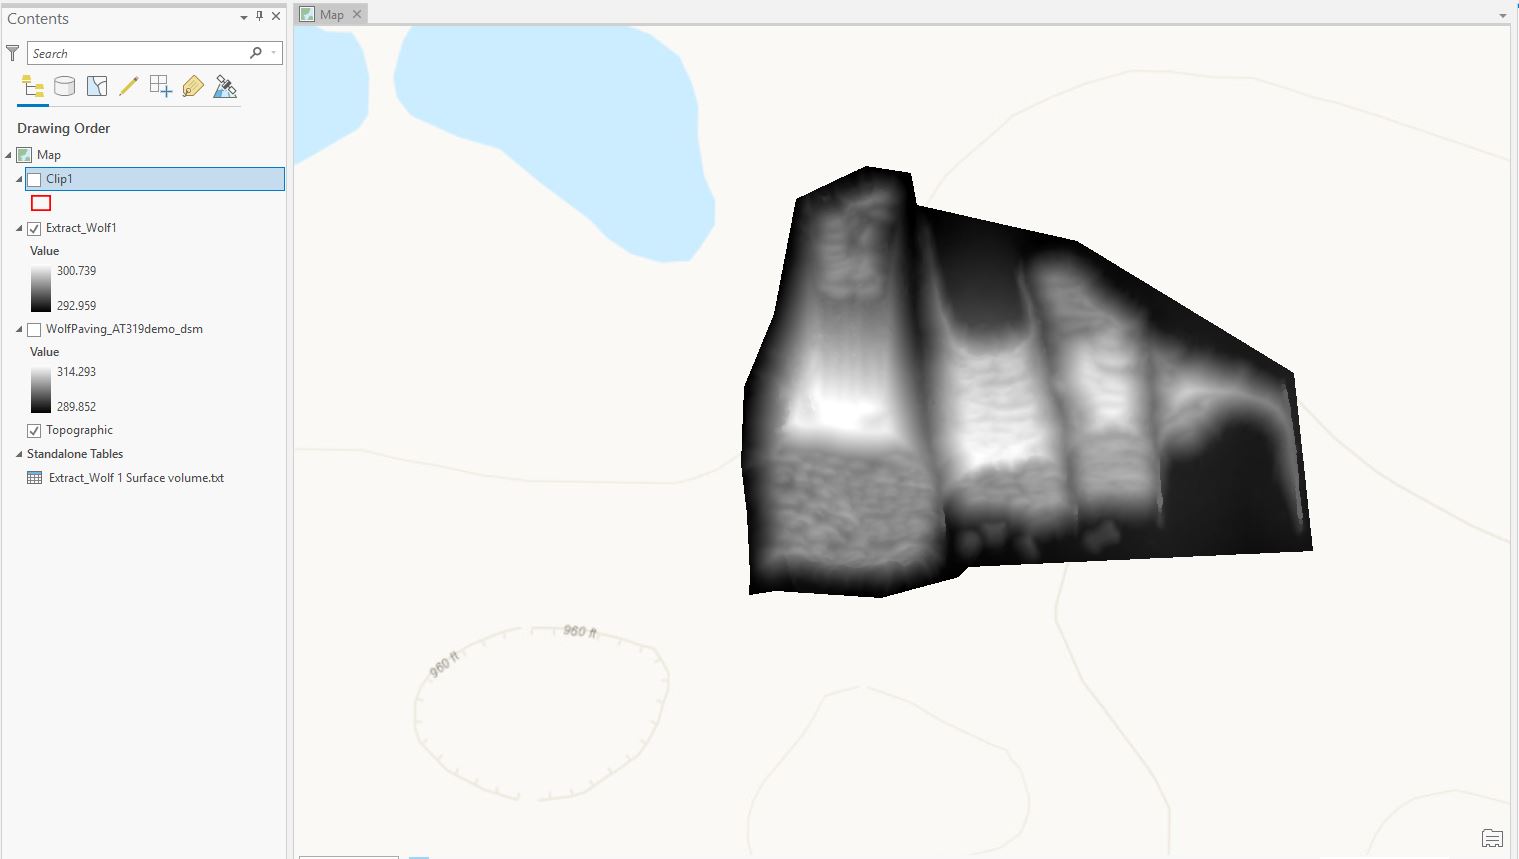 |
Figure 4: Arc Pro volume part 1
|
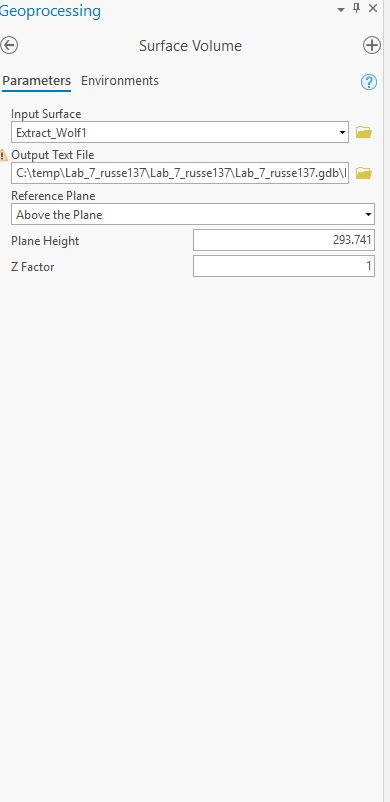
Figure 5: Arc Pro average elevation
 |
| Figure 6 |
 |
| Figure 7 |
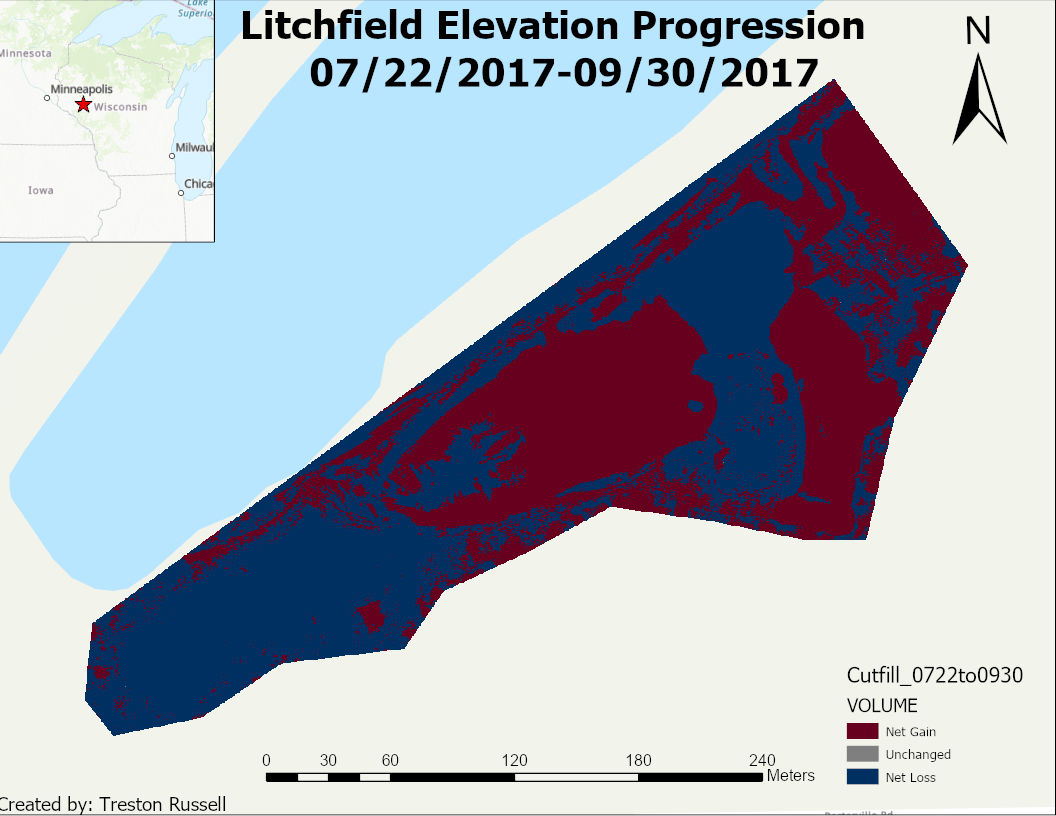
Part 2:
Part two's focus was on the new Litchfield data set. The data included three different raster data sets representing three consecutive months of the area. After inputting the data, they all needed to be resampled to get the same pixel size. for all three. The Resampling tool changes the spatial resolution of the raster data. This was used to increase the accuracy of the comparison by changing the three raster datas to 10cm pixel size. Surface volume was then found for each raster data set, Figure 6 represents the comparison over time. Cut Fill was then used to visually compare the surface volume of the three raster sets, represented in Figure 7. Mapping of the area's three rasters was created in a side by side represented in Figure 8.
Figure 6
 |
| Figure 7 |
 |
| Figure 8 |
No comments:
Post a Comment