This weeks lab consisted of following an online lesson, Calculate Impervious Surfaces from Spectral Imagery, from Learn ArcGIS Online Lesson Gallery. The lesson consists of three sections: Segment the imagery, Classify the imagery and Calculate impervious surface area, but the first two sections were the only assigned portions of the lesson. The goal of the lesson is to understand the process of how to take UAS data and be able to identify and calculate the surface area of impervious areas.
Segment the imagery-
Before we can classify the impervious and pervious areas, once the data is downloaded, we have to change the bands combination to allow the features to clearly show. This step was done with the Extract bands tool in the raster function pane. Extract bands tool makes a new image that uses different colors to display the difference between the pervious and impervious areas in the map, shown in figure 1.
 |
| Figure 1: Extracted bands |
 |
| Figure 2: Segmented classification |
Classify the imagery
After getting segmenting for easier classification, the second section begins by creating training samples. Training samples are polygons created in general areas of either pervious and impervious areas to distinguish the difference, and categorize what each color represents. So two training samples were created to classify pervious versus impervious areas, and given their own distinct color. Then subclasses were made within each training sample to classify the what the exact area represents, like for impervious there are gray roofs, driveways and roads, whereas pervious has bare earth, grass, water and shadows. These samples will later be used to distinguish what area each pixel represents.
The next step finally classifies the image, representing pervious versus impervious. After clicking run the map should change colors representing the areas classified as pervious or impervious like figure 3.
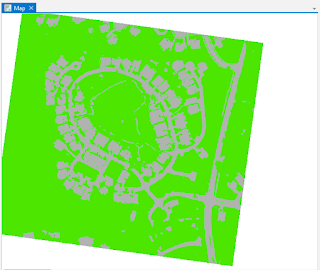
After running the classification, it is important to reclassify small errors within the map. So for the final page of the wizard the Reclassification page allows you to find these mistakes and correct them. My run did not experience any errors in the preview. Then finally the final classification is to be ran for the final map. After selecting finish the final map should look like figure 4, with green representing pervious areas and grey areas.
 |
| Figure 3: Classified areas |
 |
| Figure 4: Pervious versus Impervious areas |
No comments:
Post a Comment