· What makes data geospatial? That is, what makes the data you worked with today geospatial in nature (think coordinates)?
This data is geospatial data because we geographic features to calculate deforestation and possible deforestation.
· What makes data in a GIS different than a digital map?
Data in GIS is actual data that can be calculated, whereas a digital map really only allows a visual reference.
· Why is having an understanding of geospatial concepts and geospatial data so fundamental to working with UAS data?
A good understanding of GIS is important for the UAS world because mapping areas and planning are what UAS excel in, and having this understanding will allow one to do this work accurate and efficient.
· What are some of the key geospatial concepts and fundamentals that this lab addresses?
This lab addresses the different types of data used in GIS, the different data tools available and the concept of well planned designs.
Part 2 (Methods/Lab Assignment): In this section, provide an overview of what you did in this tutorial. Use the questions you answered to guide the reader through what you did. Try to relate to your experience with UAS as you do this. Also note that in later labs you will be asked to write a more formal methods section, this is to get you to understand what to put.
The lab this week was designed to get us familiar with ArcGIS Pro, and its many applications. To get started we opened the Rondonia file provided for us, and applied basic setup for the project. An imagery basemap was used to get a better visual of the forest and civilization (figure 1). Other maps would allow better visuals of desired contrasts. When the map is shown, the data presented are vector lines and points.
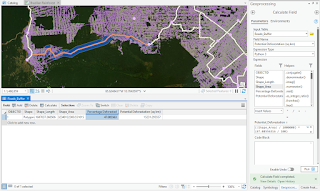
Symbolization was added to the official road systems and unofficial road systems to easily display the analysis area as shown in figures 2 and 3. This analysis area will be used to determine the amount of deforestation that could happen with building the new proposed road through the city. Majority of the data used in the analysis is vector lines for the roads, vector points for the cities and raster data for the proposed road as well as the deforested areas. A tool used in this project are the buffer tool, create an offset at a specified distance from the input feature allowing us to calculate the amount of deforestation that happens within 5.5 km of a road. The UAS profession can use this tool for mission planning to setup the parameters of the mission. Once the proposed road is placed in the map and traced with the create feature tab,shown in figure 4, 5 and 6, the possible deforestation with the roads development was found. After the deforestation is found, shown in figure 7, the rest of the lab was spent getting a professional presentation of the final product of the lab with a legend. Figure 8 and 9 represent the steps used to get the final project, shown in figure 10.
Figure 1
Figure 2
Figure 3
Figure 4
Figure 5
Figure 6
Figure 7
Figure 8
Figure 9
Figure 10
Part 3 (Conclusions):
· Summarize how ArcPro as a GIS software. What makes it stand out
ArcPro stands out because based on this lab it allows many applications for accurate planning.
· We talked about all the issues that can come up when working with UAS data in a GIS. After this intro to the software, reflect on how its complexity could create problems with using UAS data.
It can cause problems by not getting accurate enough data, or data that is not compatible with ArcPro.
· Speculate how the data you worked with in this tutorial could be supplemented with UAS data.
The data in this lab can be supplemented with UAS data by giving more area of data easier but not as accurate as UAS gathered data.


No comments:
Post a Comment