Part 1 (Introduction):
· Why are proper cartographic skills essential in working with UAS data?
Proper cartographic skills for UAS data allows detrimental data to be collected and displayed properly.
· What are the fundamentals of turning either a drawing or an aerial image into a map?
Fundamental elements for any drawing or image to be a map are: a title, north arrow, scale bar, locator map, watermark, data sources and appropriate metadata.
· What can spatial patterns of data tell the reader about UAS data? Provide several examples.
Spatial patterns of data are detailed distances of the region collected by the UAS that the reader is able to distinguish what the data represents. An example of spatial patterns would be city density, population density and forestation density. These all display spatial representation, and should have a legend that identifies the difference in the area.
· What are the objectives of the lab?
The objectives of the lab is to teach us all of the possible data that can be produced and how to develop these maps pertaining to the desired map and information. This information can be used in many facets of data collection as explained in the previous question.
Part 2 (Methods):
o What key characteristics should go into folder and file naming conventions
Key characteristics in folder and file naming conventions include careful locating of each file to allow proper sequencing and easy locating, file naming must be descriptive of the material within.
o Why is file management so key in working with UAS data? How does this relate to the metadata?
Good file management is key to UAS data because there can get to be a lot of data taken and analysed which can get lost or confused within the data haystack. This relates to metadata because it is just as important to keep a good track of all metadata information.
o What key forms of metadata should be associated with every UAS mission
Essential forms of metadata include the pilot’s name, date flown, platform used, sensor used, coordinate system of imagery, and coordinate system of ground control GPS (if used).
o What basemap did you use? Why?
The basemap used was the given black to white topographic map. This was used because it defines the features of the project area.
· You built Pyramids and Calculate Statistics for each data set. Enter the descriptive statistics into a table and insert this into your report.
o What is the purpose of these commands
The Pyramid command’s purpose is to provide a better picture when zooming in and out by grouping the pixels together accordingly. The Calculate Statistics command allows the selected data to be analysed to find all elevations.
o Why might knowing Cell Size, Units, Projection, Highest Elevation, Lowest Elevation be important?
This data is important to know because it gives you the information needed to plan accordingly.
o What is the difference between a DSM and DEM?
The difference between a DSM and a DEM is that a DSM displays all features in the study area such as elevation, trees, vegetation, and other protruding features. A DEM only shows the elevation of the terrain and no other features listed with the DSM.
o What does hillshading do towards being able to visualize relief and topography.
Hillshading gives the picture shading relative to a certain degree of slope. The features with a higher slope have a darker representation, whereas the less slope features have a lighter representation of color. Figure 1 represents the Hillshade map.
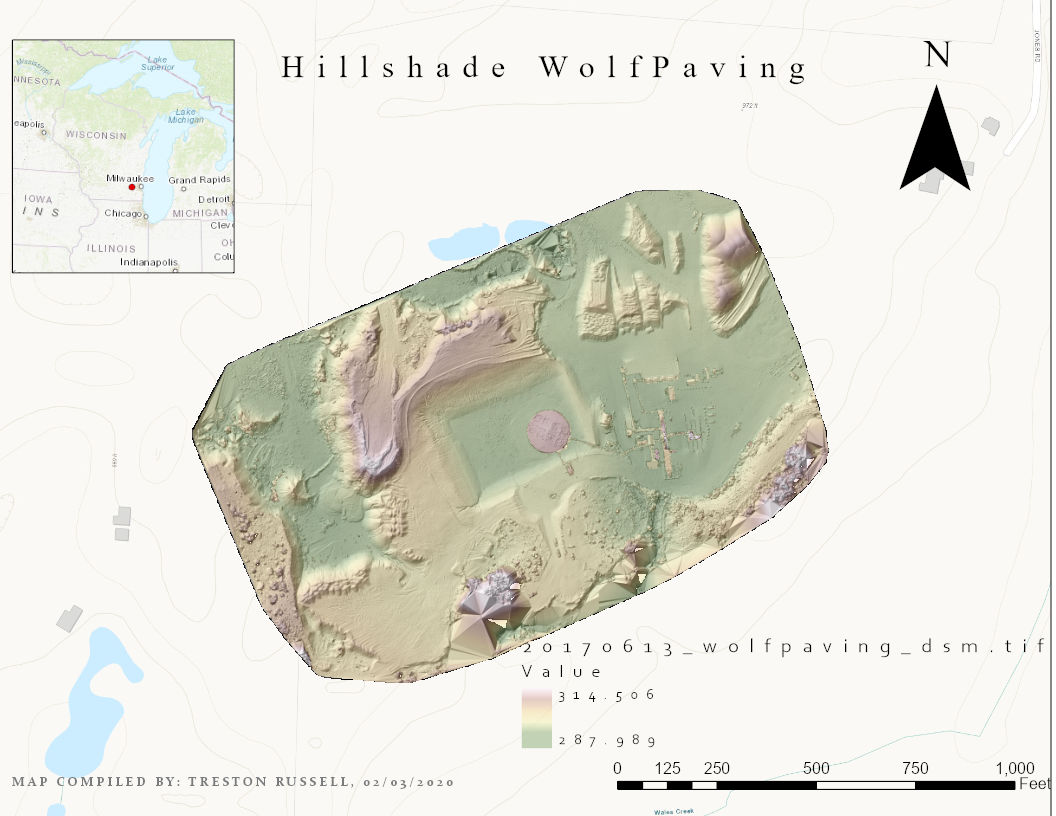 |
| Figure 1 |
o How does the orthomosaic relate to what you see in the shaded relief of the DSM
Orthomosaic gives a realistic view of the map by displaying all of the real world features in the area, instead of colors. But the relation between the two allows you to visualize the features along with their relative elevation. This is displayed in Figure 2.
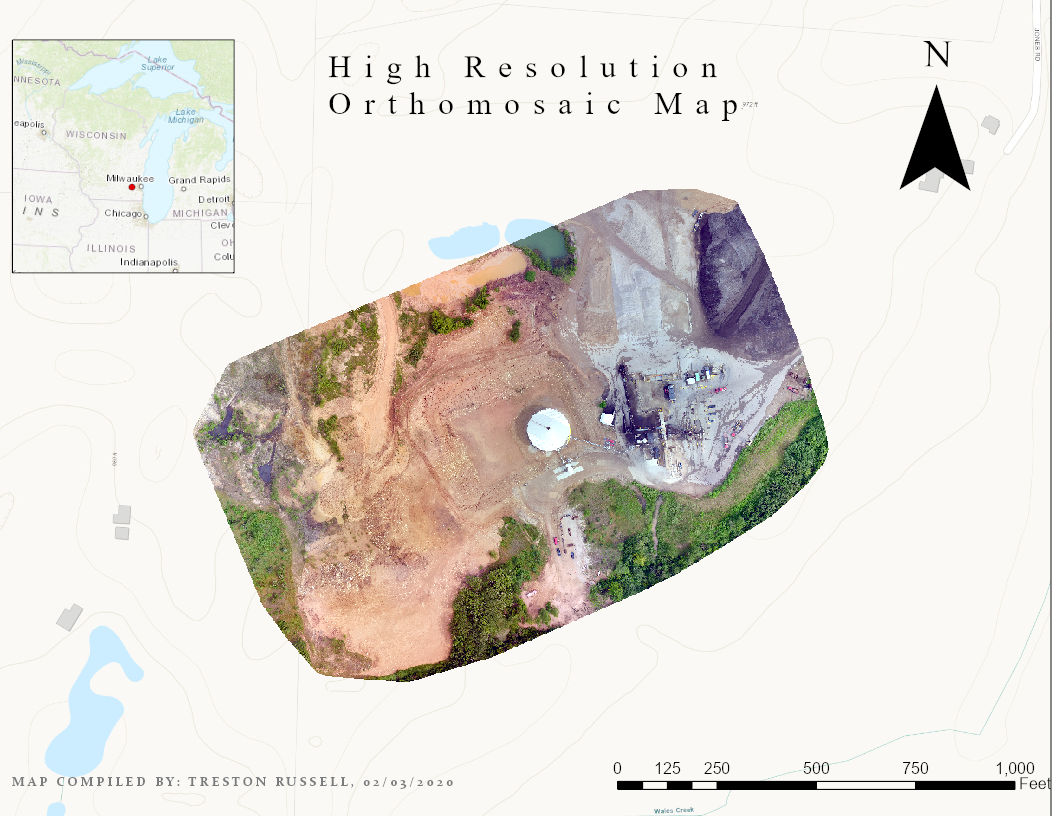 |
| Figure 2 |
o What benefits does hillshade and 3D view provide? How might this relate to presenting this information to a client/customer?
The hillshade and 3D view provide elevation representation with the shading, along with realistic 3D imaging displaying the physical heights of the features. This relates to presenting this information because it looks more professional along with helping the customers/clients visualize the map easier.
o What color ramp did you use? Why?
The color ramp I used represents lower elevation with a greener shade and moves to yellow then a pinkish with higher elevations. I chose it because I believe it easily represents the difference in elevations.
· You also Generated slope and aspect of the DSM.
o How might these forms of value added data analysis prove useful to various applied situations?
These are useful for people who are concerned with ground movement and strength, either for erosion data collection or ground surveying. This is represented in figures 3 and 4.
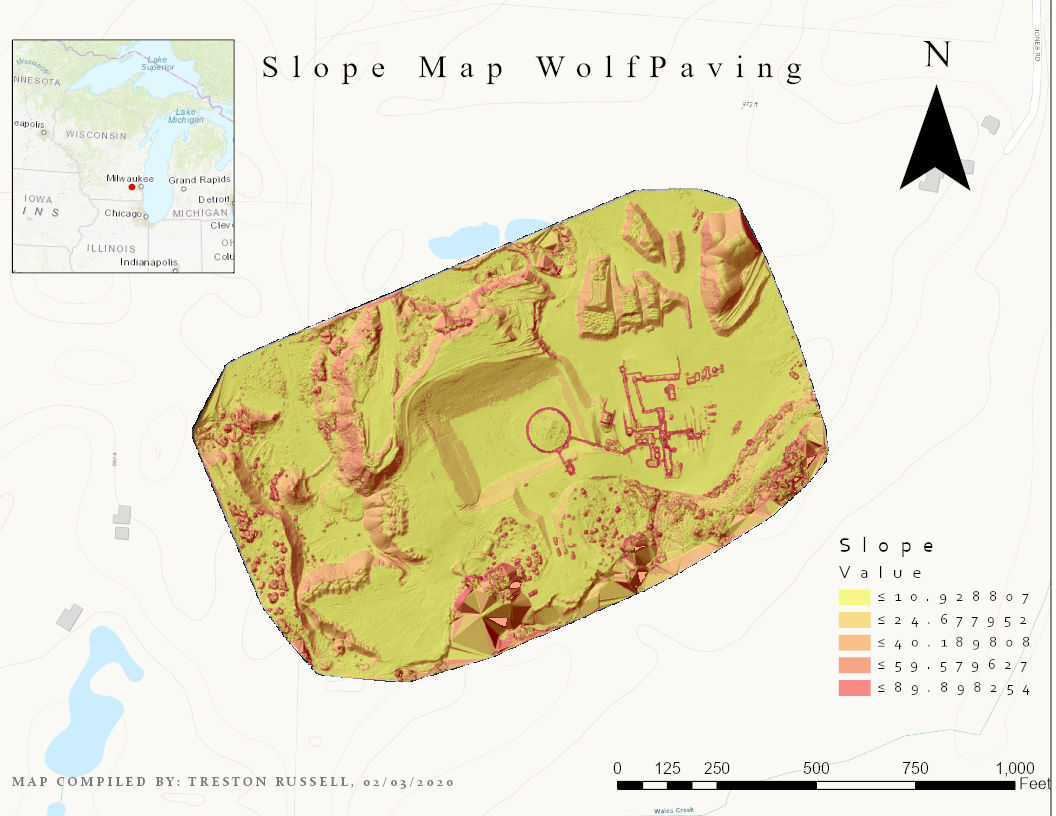 |
| Figure 3 |
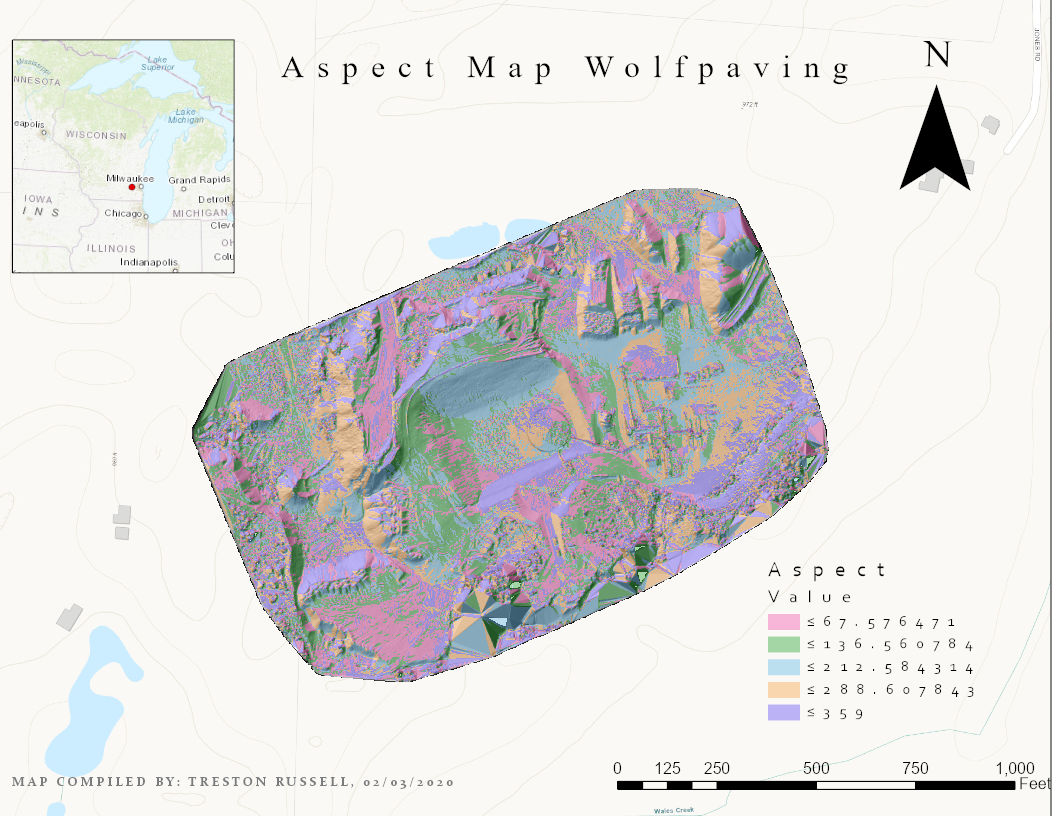 |
| Figure 4 |
Part 3 (Conclusions):
· Summarize what makes UAS data useful as a tool to the cartographer and GIS user
UAS data is useful because not only is it fairly accurate, but it is very fast and easy to capture the data. For a cartographer and GiS user it is useful because it saves time and money, for the most part, and is easily compatible with GIS, allowing an easier process for the users.
· What limitations does the data have? What should the user know about the data when working with it.
Data has many forms of limitation. The equipment used can have physical limitations or a limit to its capabilities. Also data is sensitive so if it is stored incorrectly or something happened to the transfer process, the data can become corrupted or you can just find out that it wasn’t collected properly.
· Speculate what other forms of data this data could be combined with to make it even more useful.
Other forms of data able to be combined with this data can be future changes to the land or its surroundings. Also the difference in seasons might change the data significantly. To get a better idea of the land itself, saturation levels could be determined and used to help with further planning.
No comments:
Post a Comment